community-based, non-corporate, participatory media
Inhofe attacks global warming / No sir !
by Pat N
Sunday, Apr. 10, 2005 at 3:12 AM
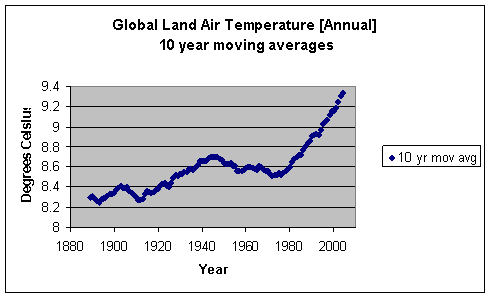
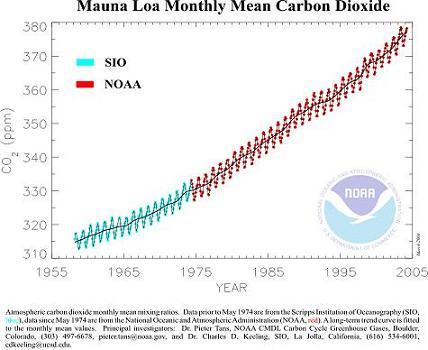
U.S. Sen. Jim Inhofe, R-Okla said ... snip ... (tulsaworld.com 4/8/2005) No sir ! Rapid increases in CO2 and global temperatures are not coincidental, fossil fuel emissions are to blame for causing rapid global warming which is already happening. See figures on CO2 and global temperatures increasing (below).
-- PS --
Inhofe story at:
http://groups.yahoo.com/group/Paleontology_and_Climate/message/12661
THE WORLD IS IN CRISIS DUE TO GLOBAL WARMING!
Let's leave some for the others that come later.
CONSERVE, NOW! - A Proposal for Governmental Action to Combat Global Warming
http://groups.yahoo.com/group/Paleontology_and_Climate_Articles/message/486
Please show your support to reduce greenhouse gas emissions.
----------
Figures
Global Temperatures
Top of Mauna Loa Volcano, Hawaii
CO2 accumulation and growth rates(El Nino effects)
-------
Figures showing CO2, global temps also at: http://okimc.org/newswire.php?story_id=703
Discussion group at:
http://groups.yahoo.com/group/Paleontology_and_Climate/
Top of Mauna Loa Volcano, Hawaii
by Pat N
Sunday, Apr. 10, 2005 at 3:12 AM
CO2 accumulation and growth rates(El Nino effects)
by Pat N
Sunday, Apr. 10, 2005 at 3:12 AM
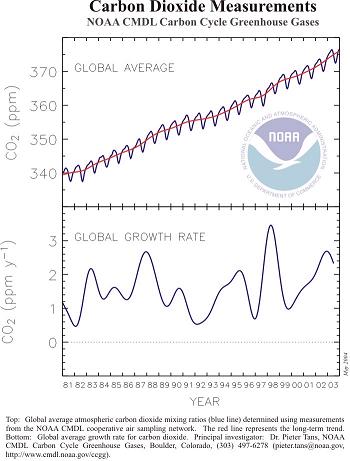
Just look at the figures
by Pat N
Sunday, Apr. 10, 2005 at 8:53 AM
-
The figures show what's going on. It should be obvious, even to political figures that have no time for anything but themselves.
You study false positives Pat.
by Peter K Anderson
Monday, Feb. 13, 2006 at 6:45 PM
hartlod@bigpond.com
To demonstrate the flimsy state of the 'greenhouse' platform I will again mention the constantly given 'greenhouse examples' regarding the 'situation' on Venus, with mention of some exampled 'greenhouse statistics' for the Moon and Earth.
To refresh the mind of the reader:-
____________________________
The energy of incident Photons is placed into a CASCADE of Photons within the Atmosphere where it is moved tween 'repeaters' such as CH4 and NO2, step-down agents like CO2 (that remove a little energy before reemitting the residual as a secondary photon) or the terminator (being the H2O molecule) that produces large kinetic gains of the molecule (measureable as 'temperature') with little remittance of energy as secondary Photons and thus lowering rapidly the energy content of the Cascade.
a) Alternatively these Photons might escape to open space, the more likely trended behavior.
This is very likely as atmospheric density is reducing with altitude and so 'incidence rates' with molecules for these Photons is REDUCING with altitude. Also with increased altitude the atmosphere retains less H2O, this molecule being constrained by the condensation and ice point altitudes within the atmosphere, so there is a reduced trend for cascade termination leading to induction of kinetic energy.
b) Alternatively these Photons MIGHT become surface incident, the LESS likely trend.
Due to INCREASES in atmospheric density, more Cascade interactions will ensue. With that lower 'rate' of incidence, as the higher atmospheric density increases, and the cascade terminator H2O is at its HIGHEST 'concentration' you find the opportunities for cascade Photons to reach the surface with any statistically SIGNIFICANT energy load is indeed minimal.
____________________________
There is more energy being intercepted and suspended within the Atmosphere of this Planet (see slide link below), and once suspended the STATISTICALLY trended direction of ESCAPE is towards higher altitudes.
There is LESS energy incident to the surface of this planet (can provide slide) and the opportunity is given for more energy to escape altogether by the functions of this planets atmosphere.
Hence the 'statistics' often quoted, relating:-
["The albedo of the earth is approximately 39% while the moon's albedo is about 12%.']
-: is in fact indicating the activity of the process within the Earths atmosphere to direct suspended photons with trended motion being AWAY from the surface.
Infact, the comparison of Moon and Earth indicates the removal of photons from the atmospheric cascade within the Earth's Atmosphere, as the lack of a Lunar Atmosphere allows no interdiction of incident photons and so the only remittance you will record is secondary photonic remittance from the actual Lunar Surface materialing.
There is more energy being intercepted and suspended within the Atmosphere of this Planet, than becomes surface incident, and once suspended the STATISTICALLY trended direction of ESCAPE is towards higher altitudes, as in (a) above.
Remember Photosynthesis interdicts and consumes the incident energy predominately in the lower and upper visible spectrum. It is that only energy within the lower and upper visible spectrum as well as the lower third of the overall UV spectrum can become surface incident (as per slide).
The average temperature of the lunar surface (~110 degrees K) includes the very cool dark side, whilst the 'brightside' temperature is limited to the interactions of the materials that compose the surface. This lowers the average (in comparison to that of this planet, being ~283 degrees K) and thus the 'average temperature' statistic is a poorly realised number, and is invalid in its usage within presentations attempting to present 'existence'
of a 'greenhouse effect'. It is however indicative of the differing materials of the surfaces, and their behaviors under bombardment by incident Radiation.
(The below figure is in the FILES section of the Yahoo climate-change group, also available in powertothepeople, foeb and bluegreenearth group, see Files
sections)
<
Picture1.jpg
>
On to the 'Venus" issue, let it be remembered that Venus has no perceived magnetic field of any consequence AT PRESENT, therefore has no permanent creation of a planetary ambient (surrounding) plasma interaction to interdict photons within the Gamma and X-ray Spectrums as this planet Earth has.
TO quote:-
["Venus is sometimes characterized as Earth's 'twin' because of its close proximity in solar system location (~ 0.72 AU heliocentric distance compared to 1.0 AU) and its similar size (~ 6053 km radius compared to - 6371 km radius), but other close resemblances are few. Besides the more obvious atmospheric composition and pressure differences, and the related extreme temperatures at the surface described elsewhere in this volume, events in the history and evolution of the interior of Venus have left that planet with practically no intrinsic magnetic field. The consequences for the space environment and atmosphere are numerous, ranging from the presence of an 'induced' magnetotail in the wake, to an ionosphere and upper atmosphere that are constantly being scavenged by the passing solar wind."]
Which continues after some use of non essential (for this discussion) material into:-
["The observed fields for the most part could be explained as solar wind interaction-induced features, to be described below. The new upper limit on the dipole moment obtained from the Pioneer Venus Orbiter wake measurements placed the Venus intrinsic magnetic field at ~ 10-5 times that of Earth."]
Then there is the discussion that brings forth the issues so often related by 'greenhouse platformers' with the 'there was <something> on Venus but greenhouse...'.
To quote:-
["Of course, the weakness of the present measurement does not imply that Venus has always been bereft of an intrinsic field. =>THEORIES OF THE DYNAMOS OPERATING IN THE LIQUID CORES OF THE NEWLY ACCRETED TERRESTRIAL PLANETS SUGGEST THAT THERE WAS A MAGNETIC MOMENT OF VENUS OF THE SAME ORDER AS EARTH'S FOR ABOUT THE FIRST BILLION YEARS OF VENUS' LIFE. <= ..........."]
Thus it was that the 'magnetic shield' fell around Venus and an enormous amount of energy began to stream into the 'biosphere' of Venus. It was NOT 'greenhouse behavior' that created 'Venus' as it is today, but the failure of its magnetically induced shield.
As an aside, the "~100%" Albedo quoted for Venus is indicative of the density of the atmosphere of Venus and the temperature is driven by the differing materials and energy interactions with the Photons propagating this energy, see (a) above.
There is little to deflect the energy within the Gamma and X-ray spectrums within the atmospheric structure of Venus, as exists here with Earth's ambient plasma, hence the temperatures observed on Venus is due to the energy within the incident Gamma and X-Ray spectrums that would not be expected to enter a cascade within the atmosphere present on Venus, and so this energy becomes surface incident.
Thus the 'runaway' effect was infact that of increasing availability of energy, not at all related to any supposed 'Greenhouse Effect'.
There is no need to consider 'flying' a cause of 'climate change' or 'global warming', and outside of air pollution concerns, no need to restrict or cease flying at all.
Realise also that the 0.6 degree rise in average surface temperature so far recorded is infact indicative of the kinetic energy inducted in to surface NOT as yet Conducted into the Atmosphere or Oceans to being actions within the process of Convection.
The alterations to turbulence so far noted are infact due to the kinetic energy that has already been REMOVED from the surface and so would no longer be measurable as 'temperature'.
The alterations to the inductance rate OF kinetic energy is due to the alterations to the surface materialing by Humanity over the past 400 years, with a rapid increase in such activity within the next 100 years requiring IMMEDIATE notice instead of the constant platforming of 'greenhouse' concerns and 'potential scenarios' so related by bodies such as the IPCC.
For simplicity I have outlined the population effects within the 'climate-change' group with further slides.
"Save the environment, ignore Greenhouse platformers".
Your's, Peter K. Anderson a.k.a. Hartlod(tm) From the PC of Peter K Anderson
E-Mail: Hartlod@bigpond.com
It is very easy to realise...
by Peter K Anderson
Monday, Feb. 13, 2006 at 6:51 PM
hartlod@bigpond.com
Slide above:- 'population density (geographical) you see density of the human population 1994 (Source: CIESIN). (Yellow = low density - dark red = high density)
As has been mentioned, the fetish for 'temperature' plots is not able to validate opinions of 'global warming' due to inadequate statistical methods being employed.
One million data points in the last 30 years is only defining a statistically insignificant time-frame of the overall climate oscillation. Thus the 'global warming' opinions related to these plots are basing the 'analysis' on an insignificant observed portion of a long term oscillation.
If one observes an actual curve in too fine a detail, one might think that one is looking at a linear plot. This is the basis of what if happening, the 'global warmers' have taken a little bit of a curve within an oscillation and made it to be a linear style relationship.
What these 'global warmers' are deliberately avoiding also is that there has been a noted warming/cooling/warming mini oscillation occurring in global climate since 1880. This is even seen in the plot Pat provides. This micro-oscillation has been noted in many comments in many places by many people. One such comment i will add below my post.
There is also the motion of human population across the surface in line with population growth, as shown in the slide i include here. The alteration of the surface associated with this increase in population has led to alterations of what would be 'pleasant green terrain' to become covered to various densities in coverage of concrete and asphalt.
WE all know that concrete and asphalt get very much hotter than even grassed terrain, and this has led to the small increase in average SURFACE temperatures observed as 0.6 degrees C.
WE have barely 200 years of records and even then for only various portion of the region as it were ‘settled’. On a scale of global climate, even one million data points within those 200 years is only defining well a ‘statistically insignificant period’.
To even attempt to lead from data collections that Pat overplays futures millions of years ahead is simply not SCIENCE. That the attempt to 'support' 'greenhouse concepts' is constantly based in events of hundreds of millions of years ago (with the attached vague vapidity) is evidence of the scant SCIENCE that can be applied NOW related to such 'greenhouse concepts'.
The overall natural climate cycle saw an ‘Ice Age’ being to revert ~20,000 years ago, which occupies the ‘trough’ of the climate oscillation. We are all now at, if not even within, the ‘peak’ of that oscillation. WE have a dry equatorial zone, with a heavily photosynthetic covering of the temperate zone (if you include the photosynthetic mass so far removed by Humanity within the last 400 years) and warming Polar Regions.
There is no reason to think that the motion of the oscillation peak will progress any faster than through a trough (and its often contained “Ice Age”) and so ‘peak oscillation climate fluctuations’ could last multiple centuries.
As such the ‘peak’ will present shifting behaviors, in as far as Humanity defines ‘seasons’ (which need not be considered ‘natural and permanent’ being definitions OF Humanity only) without any needed periodicity in these alterations. Rain patterning will alter its density and distribution. Wind and ocean currents will show some disturbances to various degrees.
These will manifest differing behaviors within regions that are NOT 'global' in scale.
One such region is in and around the Gulf of Mexico, which can at this point within the oscillation, produce storms of vast surface coverage from little more kinetic energy than currently available. These events are those that open the multiple sea channels along the Florida coastline and nearby environs (New Orleans for example has seen ONE open) which produce the 'Lake Land' that the State of Florida region HAS been in the 'past'.
I did attempt to discuss preemptively (before 'Katrina') by a number of months, but persons like Pat and Gavin censored and prevented such discussion in the Yahoo! Groups.
(I can document the censorship so there is little point in continuing these 'slander sessions' of myself either, but that has not stopped these few yet.)
Realise that there has NOT been what can be regarded as permanent Ice on this planet over the last BILLION years, which has seen great periods that have involved cycles of glaciations within them.
The present cycle we are within would appear to have persisted for around 2 MILLION years.
Look to:- < http://www.museum.state.il.us/exhibits/ice_ages/ > for information.
The plots of human population reproduce exactly in shape that seen in the numerous 'co2 plots', and it is therefore NOT possible to remove the population attached surface rematerialing produced by the humanity and alterations to planetary surface kinetic energy induction rates. There is then also the inability of CO2 to actually produce behavior that is in any manner consistent with that presented as 'greenhouse behavior' within the supposed 'greenhouse effect'.
I include population density plot above to indicate human habitat, if you overlay plot of marginal terrain (deserts and near deserts), you will see where future population will tend to move, humans do seem to prefer 'green' to build upon.
It is very easy to realise Pat, it is NOT that the 'politicians' are 'self interested', they are politicians, and when people say the 'things' as you do Pat, that defy logic, SCIENCE and avoid commonly known 'near current' climate behaviors and situations, they tend to look interested then do nothing, as that is the right thing for them to do in response to the claims you seem to promote.
Your's, Peter K. Anderson a.k.a. Hartlod(tm)
From the PC of Peter K Anderson
E-Mail: Hartlod@bigpond.com
With regard to:-
'A chronology of climate change'
During most of the last billion years the Earth did not have permanent ice sheets. Nevertheless, at times large areas of the globe were covered with vast sheets of ice. Such times are known as glaciations. In the past 2 million to 3 million years, the temperature of the Earth has changed (warmed or cooled) at least 17 times, some say 33, with glaciations that last about 100,000 years interrupted by warm periods that last about 10,000 years.
The last glaciation began 70,000 years ago and ended about 10,000 years ago. The Earth was a lot colder than it is now; snow and ice had accumulated on a lot of the land, glaciers existed on large areas and the sea levels were lower.
15,000 years ago: The last glaciation reaches a peak, with continental glaciers that cover a lot of the sub-polar and polar areas of the land areas of Earth. In North America, all of New England and all of the Great Lakes area, most of Ohio, Indiana, Minnesota and the North Dakotas, lie under ice sheets hundreds of meters thick. More than 37 million cubic kilometers of ice was tied up in these global sheets of ice. The average temperature on the surface of the Earth is estimated to have been cooler by approximately 6 degrees Celsius than currently. The sea level was more than 90 meters lower than currently.
15,000 years ago to 6,000 years ago: Global warming begins. The sheets of ice melt, and sea levels rise. Some heat source causes approximately 37 million cubic kilometers of ice to melt in approximately 9,000 years. Around 9,500 years ago, the last of the Northern European sheets of ice leave Scandinavia. Around 7,500 years ago, the last of the American sheets of ice leave Canada. This warming is neither stable nor the same everywhere. There are periods when mountain glaciers advance, and periods when they withdraw. These climatic changes vary extensively from place to place, with some areas affected while others are not. The tendency of warming is global and obvious, but very uneven. The causes of this period of warming are unknown.
8,000 years ago to 4,000 years ago: About 6,000 years ago, temperatures on the surface of Earth are about 3 degrees warmer than currently. The Arctic Ocean is ice-free, and mountain glaciers have disappeared from the mountains of Norway and the Alps in Europe, and from the Rocky Mountains of the United States and Canada. The ocean of the world is some three meters higher than currently. A lot of the present desert of the Sahara has a more humid, savannah-like climate, with giraffes and savannah fauna species.
4,000 years ago to AD 900: Global cooling begins. The Arctic Ocean freezes over, mountain glaciers form once more in the Rocky Mountains, in Norway and in the Alps. The Black Sea freezes over several times, and ice forms on the Nile in Egypt. Northern Europe gets a lot wetter, and the marshes develop again in previously dry areas. The sea level drops to approximately its present level. The temperatures on the surface of the Earth are about 0.5-1 degree cooler than at present. The causes of this period of cooling are unknown.
AD 1000 to 1500: This period has quick, but uneven, warming of the climate of the Northern Hemisphere. The North Atlantic becomes ice-free and Norse exploration as far as North America takes place. The Norse colonies in Greenland even export crop surpluses to Scandinavia. Wine grapes grow in southern Britain. The temperatures are from 3-8 degrees warmer than currently. The period lasts only a brief 500 years. By the year 1500, it has vanished. The Earth experiences as much warming between the 11th and the 13th century as is now predicted by global-warming scientists for the next century. The causes of this period of warming are unknown.
1430 to 1880: This is a period of the fast but uneven cooling of Northern Hemisphere climates. Norwegian glaciers advance to their most distant extension in post-glacial times. The northern forests disappear, to be replaced with tundra. Severe winters characterize a lot of Europe and North America. The channels and rivers get colder, the snows get heavy, and the summers cool and short. The temperatures on the surface of the world are about 0.5-1.5 degrees cooler than present. In the United States, 1816 is known as the "year with no summer". Snow falls in New England in June. The widespread failure of crops and deaths due to hypothermia are common. The causes of this period of cooling are unknown.
1880 to 1940: A period of warming. The mountain glaciers recede and the ice in the Arctic Ocean begins to melt again. The causes of this period of warming are unknown.
1940 to 1977: Cooling period. The temperatures are cooler than currently. Mountain glaciers recede, and some begin to advance. The causes of this period of cooling are unknown.
1977 to present: Warming period. The summer of 2003 is said to be the warmest one since the Middle Ages. The causes of this period of warming are unknown.
-----
